

3D Scan Measurement Workflow for Precision Automotive Component Quality Control
3d scan measurement: Shop-Floor Quality Bottlenecks for High-Tolerance Automotive Powertrain Parts Why are high-value powertrain parts still piling up beside.
Shop-Floor Quality Bottlenecks for High-Tolerance Automotive Powertrain Parts
Why are high-value powertrain parts still piling up beside the CMM while the machining center sits idle? In many Western automotive plants, the bottleneck isn’t cutting time. It’s measurement wait time. A cylinder head comes off a five-axis cell, gets tagged, and moves to a climate-controlled lab for contact probing. The machinist waits. The process engineer waits. Production planning waits.
For turbocharger housings with tight GD&T callouts under ASME Y14.5, a full first-article layout can tie up a CMM for hours. That delay directly limits FAI throughput and slows feedback between quality and process teams. Scrap accumulates before a root cause is confirmed. IATF 16949 traceability demands records, but the physical queue remains.
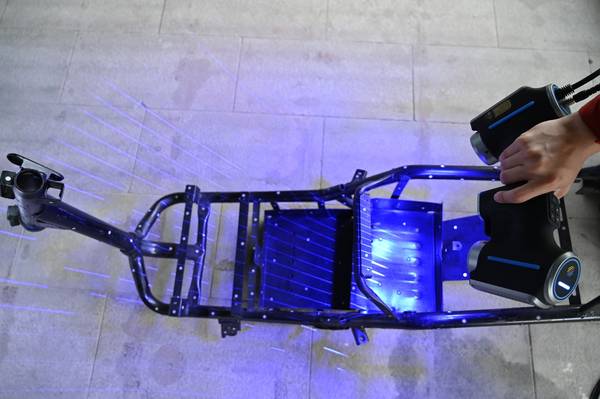
INSVISION 3D scan measurement changes that dynamic by bringing data capture closer to the shop floor. Instead of transporting parts to the gauge, the gauge comes to the part. Complex freeform surfaces, port intersections, and flange runout tolerances become visible in minutes rather than after a shift change. The result is faster exception review and fewer unplanned stops tied to measurement lag.
Deployment Validation Checklist
| Focus Area | Decision Point | Deployment Note |
|---|---|---|
| Target part | Check size, surface condition, and key tolerances against the scan task | Run a full trial scan on a representative part |
| Data workflow | Verify point cloud, deviation map, and quality-report handoff | Confirm export formats and review ownership in advance |
| Shop-floor use | Review training, calibration, lighting, and working space | Keep the validation record as a repeatable inspection reference |
Practical Workflow
- Shop-Floor Quality Bottlenecks for High-Tolerance Automot… — Why are high-value powertrain parts still piling up beside the CMM while the machining center sits idle?
- Pre-Scan Planning and Cross-Team Inspection Alignment — The most avoidable 3D scan measurement failures happen before a scanner ever powers on.
- Near-Line 3D Scan Measurement Execution and Real-Time Dat… — What happens when the scan data leaves the station?
- Point Cloud Processing, Deviation Analysis, and Traceable… — Does your current measurement workflow actually tell you why a part is drifting out of tolerance, or does it just flag another re…
Pre-Scan Planning and Cross-Team Inspection Alignment
The most avoidable 3D scan measurement failures happen before a scanner ever powers on. Misaligned expectations between quality and process teams create rework loops, disputed data, and inspection results that nobody trusts. The fix is not better hardware.
It is a defined pre-scan planning sequence that locks down inspection criteria, part condition, CAD revision control, and data context before the first reference point is captured.
Start with the joint review. A quality engineer and the process lead for the machining cell sit down with the production CAD model and agree on exactly what matters for this batch. That means specific GD&T callouts, not a vague request to “check the part.” They identify datum references, critical feature lists, and tolerance thresholds tied to how the part actually functions in assembly.
If a bore position carries a 0.05 mm true position tolerance, that gets flagged before scanning. If a surface profile tolerance only applies to a sealing face, that zone is isolated. This step prevents the scanner operator from spending two hours capturing irrelevant geometry while missing a callout buried in the drawing notes.
The same review covers part identification and surface condition. Quality confirms the serial number, batch code, and material state. Process shares what happened to the part before it reached the inspection area: recent tooling adjustments, insert changes, offset corrections, or a spindle issue that surfaced mid-batch. That context matters.
A dimensional deviation caused by a known tooling change reads differently than an unexplained drift. Without it, the quality team wastes time chasing a root cause that production already understands.
On-site setup follows a repeatable sequence. The part is staged in a near-line inspection area adjacent to the machining cell, not in a remote metrology lab. This shortens the loop between detection and correction. Reference markers are placed for consistent alignment across multiple scans or repeated measurements of the same part family. The operator verifies access to the latest nominal CAD revision before scanning begins.
Scanning against an outdated CAD model creates phantom deviations that trigger unnecessary investigations and erode confidence in the whole process.
Formal data handoff closes the loop. Process teams provide batch context and tooling adjustment notes in writing, not as a passing comment. Quality teams confirm part identification and surface condition on the inspection record. This eliminates the ambiguity that turns a straightforward 3D scan measurement into a debate about what was actually measured.
INSVISION industrial 3D scanners support this workflow by delivering dense, repeatable point cloud data that quality teams can evaluate against the agreed GD&T criteria without interpretation gaps. The scanner is not the solution by itself. The planning discipline around it is what makes the data usable.
Near-Line 3D Scan Measurement Execution and Real-Time Data Sharing
What happens when the scan data leaves the station? For many quality teams, that’s where the real bottleneck starts. A part can be measured in minutes, but if the raw point cloud sits on a local drive until someone remembers to export it, the value of near-line 3D scan measurement erodes quickly. Process engineering needs to see deviations while the batch is still running, not after the CMM queue clears three days later.
Near-line execution with INSVISION industrial 3D scanners changes that handoff. The scan itself is only half the job. The other half is making the data immediately useful to people who are not standing next to the scanner.
In a typical setup, the operator loads a standardized scan template, follows the configured path, and captures the critical features — internal cooling passages, precision mating flanges, sealing surfaces — without repositioning the part multiple times. As soon as the scan completes, the raw data is available on the shared digital thread.
Process engineering can open it, section it, and compare against GD&T callouts before the next part in the batch is even fixtured.
This is where the workflow departs from traditional offline CMM scheduling. A first-article inspection no longer requires a separate metrology lab appointment. The scan happens at the line, using the same template the next shift will use, so the result is repeatable regardless of who runs the station. For in-process batch spot checks, the operator pulls a part at the agreed interval, scans it, and releases the data.
If a flange is drifting out of flatness tolerance, engineering sees it in real time and can decide whether to adjust tooling or stop the run. The decision is based on current data, not a report that arrives after the batch has already moved downstream.
The hard-to-reach features are the clearest argument for this approach. Contact probing struggles with deep internal cooling passages or narrow flange roots. A tactile probe may not physically access the surface, or the operator spends more time building a probe path than actually measuring. With optimized scan paths, the INSVISION scanner captures those geometries in a single pass.
The software does not require the operator to make subjective decisions about where to sample points. The template defines the scan envelope, the angle increments, and the required coverage. That consistency matters when shifts change and a less experienced operator takes over the station.
For lean manufacturing teams, this supports continuous flow in a practical way. Parts do not pile up waiting for inspection. The scanner sits near the line, not in a separate lab. A batch spot check takes minutes, not hours. And because the data lives on a shared platform, the quality engineer does not have to walk out to the line, pull a USB drive, or request a file transfer.
The digital thread carries the raw scan data to whoever needs it — process engineering, tooling, or the quality manager reviewing first-article documentation.
The key is that the scan template removes most of the operator judgment. Standardized scan paths mean the same features get captured the same way on every shift. That reduces human error and makes the data comparable from part to part, batch to batch. When a deviation shows up, the team can trust that it reflects the part, not a difference in how someone happened to hold the scanner that day.
For first-article inspection, the benefit is speed without sacrificing traceability. The raw point cloud, the alignment, and the deviation color map are all stored and accessible. If a customer or auditor asks how a dimension was verified, the data is there. For in-process checks, the benefit is earlier intervention. A flange that is starting to drift can be caught before it becomes a nonconformance.
That is the kind of visibility that keeps a lean line moving instead of stopping for a containment action after the fact.
Point Cloud Processing, Deviation Analysis, and Traceable Report Delivery
Does your current measurement workflow actually tell you why a part is drifting out of tolerance, or does it just flag another rejection?
In powertrain and precision-machining environments, that question separates teams that chase scrap from teams that correct process behavior. Raw 3D scan measurement data only becomes useful when it moves through a controlled processing chain: point cloud cleaning, alignment to nominal CAD, deviation analysis, and a review loop that involves both quality and process engineering.
Skipping any one of those stages leaves you with colorful pictures instead of actionable information.
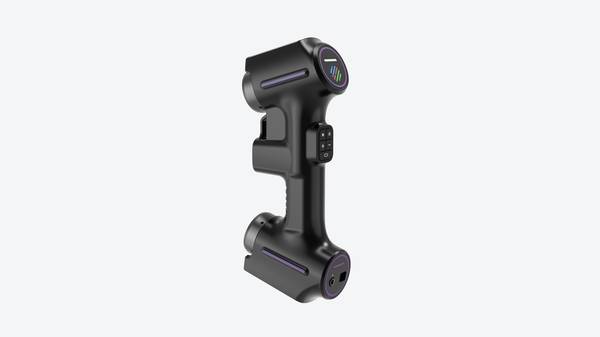
INSVISION supports this workflow with a joint review structure built into each deliverable. The goal is not a binary pass/fail report. The goal is a traceable, standards-based deviation record that quality can defend in an audit and process teams can use to identify root causes such as gradual tool wear or fixturing drift.
Point cloud processing starts with noise reduction and segmentation. Raw scan data from a machined housing, valve body, or gear carrier typically includes stray reflections, edge artifacts, and fixture geometry that should not enter the deviation calculation. Cleaning removes those elements without smoothing away real surface variation.
On parts with machined bores, sealing faces, and cast surfaces in the same dataset, this step matters. Over-cleaning hides form error. Under-cleaning creates false outliers that show up later as phantom deviations.
Alignment to nominal CAD is the next decision point. For most powertrain components, a best-fit alignment alone is not enough. Datum features defined on the drawing, such as a primary plane, secondary bore, and tertiary slot or hole pattern, should drive the alignment so that deviation results match the functional datum reference frame.
If the alignment is wrong, the entire color map is wrong, even if the scan data itself is accurate. INSVISION workflows emphasize datum-based alignment for parts where GD&T callouts control assembly behavior, not just overall shape.
Deviation analysis then follows ASME Y14.5 conventions. Surface profile, position, perpendicularity, and runout are evaluated against the CAD model. The output is not a single number. It is a distribution of deviations across functional zones. A sealing face that is consistently 0.03 mm low on one edge tells a different story than a bore that is oversized across all parts in a batch.
The first suggests fixturing or clamping distortion. The second suggests tool wear or thermal drift.
This is where the collaborative review becomes critical.
Quality teams validate the analysis parameters before results are accepted. That includes checking alignment constraints, confirming the correct GD&T standards version, and reviewing measurement uncertainty contributors such as scanner resolution, part temperature, and datum feature accessibility. If the analysis setup is not defensible, the report is not defensible.
INSVISION builds this validation step into the delivery process so that quality does not have to reconstruct how the numbers were generated.
Process teams review the same deviation data from a different angle. Instead of asking whether the part passed, they ask what changed since the last batch. A gradual shift in a bore position across 40 parts points to tool wear. A sudden change after a fixture changeover points to setup error.
Color-coded deviation heatmaps overlaid on the CAD model make these trends visible quickly, especially when the same color scale is used across sequential batches.
The final deliverable is a batch-linked measurement report. Each report references the scan data, alignment method, analysis settings, and part serial or batch number. That linkage supports IATF 16949 traceability requirements because an auditor can follow the result back to the raw data and the exact analysis configuration.
Alongside the report, native CAD-compatible deviation files are provided so process engineers can import the results into their own CAD environment for root cause work or tooling compensation planning.
For a Western manufacturing team running automotive, aerospace, energy, or medical device production, this workflow removes the gap between measurement and correction. You get a record that quality can stand behind and a deviation dataset that process engineering can actually use. That is the difference between collecting scan data and running a measurement process.
Reinspection Protocols and Closed-Loop Process Optimization
The real value of a 3D scan measurement program shows up after the first inspection is complete. Most shops can get a point cloud and a color map. Fewer can repeat that measurement across shifts, operators, and part revisions without drifting into setup chaos. That repeatability is where closed-loop process optimization either works or falls apart.
Reinspection trigger conditions should be defined before scanning starts, not improvised on the floor. Common events include out-of-tolerance feature corrections after machining adjustments, tooling changeovers that shift datum alignment, raw material batch swaps where incoming stock varies enough to affect form or surface condition, and periodic process capability checks tied to SPC intervals or customer audit schedules.
Each trigger needs a defined response: rescan the affected features, compare against the saved baseline, and route the delta report to whoever owns that process.
The INSVISION 3D scan measurement system supports this by retaining measurement templates and pre-configured scan paths. A quality engineer can build the inspection routine once, save the scan trajectory and GD&T callouts, and hand it to a second-shift operator who loads the same template and gets the same alignment, the same feature extraction, and the same reporting format.
Setup variability drops because the scan path is not being re-taught from memory. Operator variability drops because the software drives the sequence. That consistency matters when reinspection data feeds corrective action records or customer-facing capability studies.
Cross-industry applicability is broader than many buyers assume. Aerospace MRO components with blend repairs and blend-out zones need repeated scans after each material removal pass. Medical device implants with tight form tolerances on articulating surfaces require periodic capability checks across production lots.
Energy turbine parts, especially blades and vanes with airfoil curvature, need scan data after coating, blending, or tip repair. The workflow structure stays the same: define the inspection template, trigger a rescan on a known event, compare to baseline, review exceptions, and document the result. Only the part geometry and tolerance framework change.

The long-term operational value comes from aggregated data. When every reinspection uses the same template and the same alignment strategy, the measurement history becomes comparable over time. Trend charts start to reveal tool wear patterns before parts go out of tolerance. Dimensional drift on specific features points to fixture degradation or machine thermal growth.
That data supports predictive tool maintenance decisions and feeds directly into lean manufacturing initiatives focused on reducing rework, scrap, and unplanned downtime. Standardized 3D scan measurement data is not just an inspection record. It is the feedback signal that keeps the process under control.
Hangzhou Insvision Technology Co., Ltd.
Address: Building 1, No. 1399 Liangmu Road, Yuhang District, Hangzhou, Zhejiang 311121, China
Copyright © Hangzhou Insvision Technology Co., Ltd. All rights reserved.
Copyright © Hangzhou Insvision Technology Co., Ltd. All rights reserved.