

3D Imager Workflow From Shop Floor Capture To Quality Deviation Reports
3d imager: Quality Handoff Friction In Discrete Manufacturing Inspection Workflows It is easy to assume inspection bottlenecks come from slow measurement.
Quality Handoff Friction In Discrete Manufacturing Inspection Workflows
It is easy to assume inspection bottlenecks come from slow measurement tools. In most discrete manufacturing plants, the real constraint is the handoff between teams. A part sits waiting not because scanning is difficult, but because production, quality, and process engineering cannot agree on what the data means or who owns the next action.
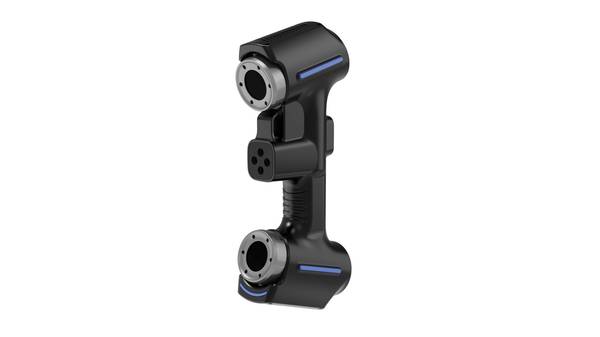
Practical Workflow
- Quality Handoff Friction In Discrete Manufacturing Inspec… — It is easy to assume inspection bottlenecks come from slow measurement tools.
- Pre-Scan Preparation And Station Setup For Cross-Team Ali… — Most factories still treat scanner setup as a technician-level task.
- On-Floor Scan Execution And Real-Time Data Handoff Betwee… — How do you keep a 3D inspection program from becoming another bottleneck on the floor?
- Point Cloud Processing And Deviation Analysis Aligned Wit… — Most engineers assume the scan itself is the hard part.
In automotive tier 1 component checks, a dimensional drift on a bracket may be caught at the line, but the quality engineer only sees a red tag hours later. The process engineer then receives a PDF report with ambiguous GD&T callouts, forcing a second meeting to interpret datum alignment. Aerospace MRO part validation suffers from similar friction.
Deployment Validation Checklist
| Focus Area | Decision Point | Deployment Note |
|---|---|---|
| Target part | Check size, surface condition, and key tolerances against the scan task | Run a full trial scan on a representative part |
| Data workflow | Verify point cloud, deviation map, and quality-report handoff | Confirm export formats and review ownership in advance |
| Shop-floor use | Review training, calibration, lighting, and working space | Keep the validation record as a repeatable inspection reference |
A repaired turbine component may pass a 2D overlay check, yet surface deviation from a blended repair zone remains invisible until assembly. Medical device implant conformity audits add another layer: manual documentation trails often fail to link measurement evidence directly to ASME Y14.5 or ISO 1101 requirements, slowing audit readiness.
Traditional workflows isolate these functions. Production owns the part, quality owns the report, process engineering owns the correction. Data moves as static images, spreadsheets, or marked-up drawings. Non-conformance alerts arrive after batch progression, not before. Lean manufacturing targets erode through waiting waste and rework loops that no single department can resolve alone.
A structured 3D imager workflow changes this dynamic. Instead of a 2D snapshot, the system captures full surface geometry at the station. The same dataset can be viewed by production for immediate pass/fail, by quality for GD&T evaluation, and by process engineering for root-cause analysis.
INSVISION industrial 3D scanning technology supports this by generating inspection data that aligns with ISO and ASME quality standard requirements, so the handoff becomes a shared digital record rather than a contested interpretation.
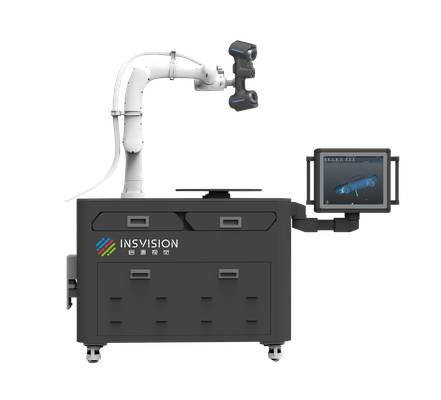
The practical impact is faster exception review. When a non-conformance appears, teams review one coordinate system, one deviation map, one set of tolerances. Rework decisions happen before parts move downstream. For Western manufacturers running lean programs, that reduction in waiting and re-interpretation time matters more than raw scanning speed. The fix is not a faster gauge.
It is removing the friction between the people who find deviations and the people who must act on them.
Pre-Scan Preparation And Station Setup For Cross-Team Alignment
Most factories still treat scanner setup as a technician-level task. That is a costly mistake. A 3D imager placed slightly off-axis, mounted on a fixture that drifts by a millimeter, or guided by a scan path that misses a datum feature will produce data that looks complete but fails correlation on second shift.
Quality and process teams need to co-own pre-inspection setup before the first part ever reaches the station. Start with fixturing guidelines written for the specific part family, not generic best practice. Define where the part sits, how it is clamped, and which surfaces remain unobstructed. Then map reference markers directly to ASME Y14.5 GD&T callouts.
If the drawing controls true position on a bore pattern, the scan plan must capture those bores with enough point density to verify position, not just visualize the surface. Pre-validated scan paths should cover every critical feature in the inspection checklist, with no operator improvisation.
INSVISION industrial 3D imagers support pre-configured station profiles, so quality engineers can lock in scan paths, exposure settings, and feature coverage once, then push the same profile to every shift. Shared work instructions built around those profiles reduce variability between operators and eliminate the ad-hoc adjustments that erode repeatability.
The result is a station where setup is a controlled process, not a skill.
On-Floor Scan Execution And Real-Time Data Handoff Between Teams
How do you keep a 3D inspection program from becoming another bottleneck on the floor? That question comes up more often as factories move away from centralized metrology labs and push dimensional checks closer to the workcell. The answer usually has less to do with scanner resolution and more to do with how scan data moves once the part is measured.
In a typical station workflow, the production operator initiates a pre-programmed scan path from the machine interface. No alignment guesswork, no manual repositioning between features. The 3D imager follows the defined sequence, captures point cloud data across the required surfaces, and completes the routine without the operator needing to interpret results.
That is the key distinction: operators run the scan, but they do not make accept/reject calls on complex geometry. Their job is to execute consistently and flag anything unusual about the part condition or scan environment.
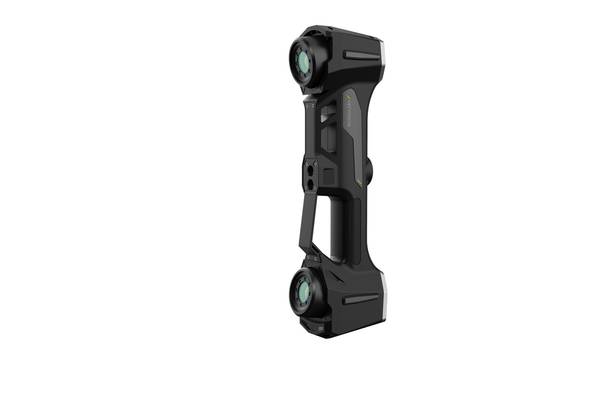
Quality engineers retain remote oversight through exception flagging. When a scan falls outside tolerance bands or captures incomplete data, the system routes that exception to the quality team for review. This split keeps inspection moving without waiting for a quality engineer to physically walk the floor for every routine check.
It also reduces the temptation for operators to make informal judgment calls that never get documented.
The real efficiency gain comes from direct data sharing between station and quality teams. Older workflows still rely on exporting files to a USB drive, walking them to a shared PC, or emailing point cloud attachments. Each transfer step adds minutes and creates version-control risk. INSVISION 3D imagers integrate with standard factory network setups to push scan data directly to shared quality management systems.
The point cloud lands where engineers already review nonconformance records, first-article reports, and SPC charts. No manual file transfer, no second copy floating around the network.
This approach fits the broader Industry 4.0 connected factory architecture. The scanner becomes a node on the production network rather than an isolated measurement tool. Quality data accumulates in the same system that tracks machine uptime, tool wear, and process parameters.
When a dimensional trend starts drifting, engineers can correlate it with other process signals instead of discovering the problem days later in a spreadsheet.
For Western manufacturers operating under ISO 9001 or AS9100 requirements, this workflow also strengthens traceability. Every scan result ties to a part serial number, a station ID, and a timestamp without relying on operator data entry. Audit trails become automatic rather than reconstructed from paper logs.
That matters in automotive OEM supply chains and aerospace MRO environments where documentation quality receives nearly as much scrutiny as part quality.
The practical takeaway is to evaluate 3D scanning systems based on data flow, not just measurement specifications. A scanner that captures excellent point clouds but forces manual file handling will still create inspection bottlenecks. The hardware and the data path need to be evaluated as one system.
Point Cloud Processing And Deviation Analysis Aligned With Quality Standards
Most engineers assume the scan itself is the hard part. It is not. The hard part is what happens between the raw point cloud and a defensible dimensional report that quality, process, and production all agree on. A 3D imager can capture millions of points in seconds, but if the downstream workflow is disorganized, those points turn into noise instead of evidence.
For medical device and aerospace work, that evidence has to stand up to audit. ISO 17025 and AS9100 do not care how fast you scanned the part. They care whether the data trail shows what was measured, how it was processed, and who approved the comparison against the CAD reference model. The post-capture workflow therefore needs to be treated as a controlled process, not an afterthought.
The practical sequence starts with automated point cloud cleaning. Raw scan data always contains outliers, reflections, and edge artifacts. Automated routines remove those consistently, which matters more than many teams admit. Manual cleaning varies by operator and shift. Automated cleaning produces repeatable inputs for mesh generation and deviation analysis.
Once the point cloud is clean, mesh generation transforms discrete points into a surface model that can be compared against the nominal CAD geometry. This comparison is where out-of-tolerance features become visible. The color map tells you where the part deviates, but it does not tell you why. That diagnosis requires looking at the pattern. Gradual drift across multiple features often points to tool wear.
A consistent offset on one side suggests fixturing shift. A sudden local deviation may indicate a process change or material inconsistency.
Shared access to centralized analysis data changes how those root cause conversations happen. In many plants, quality holds the scan data, process engineering holds the tooling records, and production holds the machine logs. Each team sees a slice of the problem.
When the deviation analysis lives in a central location that all three can access, the discussion moves from defending departmental positions to examining the same evidence. That reduces back-and-forth significantly.
INSVISION 3D imager outputs are compatible with mainstream CAD and quality inspection software, which means the point cloud and mesh data can move into existing toolchains without forcing a workflow overhaul. For aerospace MRO and medical device manufacturers, this compatibility matters because their inspection software is often validated for specific standards. Ripping out that software is not an option.
The audit trail requirement cannot be overstated. ISO 17025 expects documented procedures and records that show exactly how a measurement result was obtained. AS9100 adds traceability expectations for aerospace parts. A scan file sitting on a local drive with no version control does not meet that bar.
The centralized analysis approach gives quality managers a defensible record of what was scanned, when, how it was processed, and which CAD revision served as the reference.
The trend in industrial metrology is moving toward treating 3D scan data as part of the quality management system, not as an isolated inspection event. That shift requires thinking about point cloud processing and deviation analysis as controlled workflow steps with the same rigor applied to CMM programs or calibration records. The 3D imager is simply the data acquisition front end.
The value is in the downstream analysis and the decisions it enables.
Inspection Report Delivery And Standardized Reinspection Trigger Conditions
Most plants still treat inspection as a gate at the end of the line. Parts pass, parts fail, and the data sits in a folder until an audit or a customer complaint forces someone to open it. That mindset misses the point of a modern 3D imager. The real value is not in catching a bad part. It is in handing process engineers a stream of dimensional evidence they can act on before the next batch runs.
INSVISION supports this shift by making the final deliverable more than a green checkmark. A 3D imager can export an automated deviation report with traceable feature callouts tied directly to GD&T references.
For an automotive OEM or aerospace supplier, that means an auditor can follow a flagged hole position or surface profile back to the scan data, the CAD nominal, and the measurement timestamp without reconstructing the setup.
In MRO and legacy part replacement scenarios, the same scan can be routed to reverse engineering outputs, either a mesh or a parametric model, so a worn component with no surviving drawing becomes a manufacturable asset again.
The trigger logic matters as much as the report itself. Cross-functional teams should agree on defined reinspection conditions before a scanner goes into service. Consecutive near-tolerance batch results are an obvious one. A dimension that drifts from nominal by 70 percent of tolerance for three runs is not a pass. It is a warning. Completed MRO repairs need a verification scan regardless of how clean the rework looks.
Scheduled tool wear validation is another trigger that gets skipped too often. When a fixture or cutting tool reaches a known wear interval, scanning a sample part should be automatic, not optional.
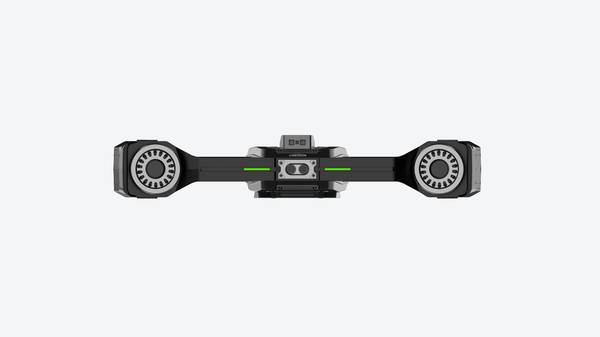
Aggregated 3D imager data changes how process engineering works. Instead of reacting to non-conforming parts, engineers can review trend lines across batches and adjust feed rates, clamping pressure, or tool offsets before a dimension crosses the line. That is the difference between inspection as a cost center and inspection as a continuous improvement input.
For Western manufacturers running lean programs or working toward AS9100 or ISO 9001 process control expectations, this kind of closed-loop data flow is becoming the baseline, not the exception.
Hangzhou Insvision Technology Co., Ltd.
Address: Building 1, No. 1399 Liangmu Road, Yuhang District, Hangzhou, Zhejiang 311121, China
Copyright © Hangzhou Insvision Technology Co., Ltd. All rights reserved.
Copyright © Hangzhou Insvision Technology Co., Ltd. All rights reserved.