

3D Part Inspection Core Principles, Key Parameters, and Practical Use Cases
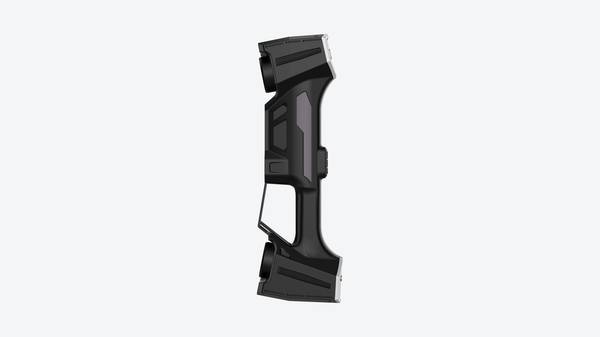
3d part inspection: Shop-Floor Context and Measurement Needs Shop-Floor Context and Measurement Needs 3D part inspection on a production floor rarely happens.
Shop-Floor Context and Measurement Needs
Shop-Floor Context and Measurement Needs
3D part inspection on a production floor rarely happens under ideal conditions. Temperature swings, vibration from nearby machining centers, coolant mist, and time pressure all work against a stable measurement routine. Yet the tolerance stack in a modern assembly — say, a turbine housing or a battery enclosure — leaves little room for doubt.
A 0.1 mm deviation in one bracket can cascade into fit-up problems three stations down the line.
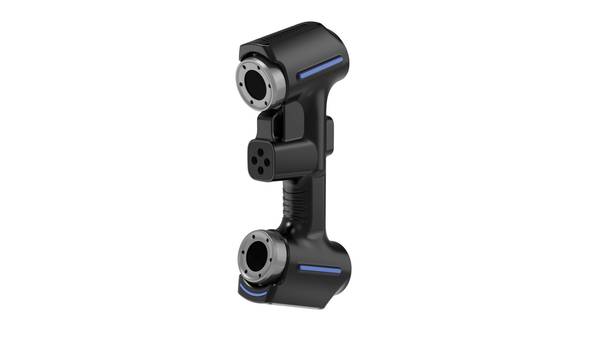
The inspection pressure is structural, not occasional. First-article inspection must clear before a production run starts. In-process checks compete with takt time. Final validation sits directly in the shipping queue. When a quality engineer cannot resolve a dimensional question quickly, the default response is to stop work and escalate — which costs throughput.
The underlying workflow problem is data flow, not just data capture. Traditional hard gauges answer pass/fail questions. CMM reports generate dense point clouds that take hours to interpret. Neither connects cleanly to the systems that need the result: MES records, SPC charts, ERP lot histories, or supplier quality files.
What the floor needs is contextual measurement data — a result tied to a specific part, fixture, operator, and time, in a format that can be queried later. The table below outlines typical shop-floor measurement contexts and what they demand from inspection data.
| Production Context | Typical Trigger | Data Requirement |
|---|---|---|
| First-article inspection | New setup, tool change, or engineering revision | Full dimensional report vs. CAD nominal, GD&T callouts |
| In-process sampling | SPC interval or operator concern | Quick pass/fail with deviation values, trendable over time |
| Rework verification | Nonconformance disposition | Targeted measurements on affected features only |
| Final audit | Pre-shipment or customer witness | Traceable record linked to serial number and lot |
| Tool wear monitoring | Scheduled interval | Repeat measurements on known wear features |
A measurement system that outputs raw geometry without traceability creates more work downstream. The inspector must manually label files, export formats, and reconcile results against part numbers. That manual step is where errors enter and where inspection becomes a bottleneck rather than a control point.
The requirement for better data is therefore not about higher resolution or faster scanning alone. It is about structured output: a measurement result that carries part identity, feature labels, nominal values, deviations, and timestamps. Only then can 3D part inspection feed directly into the quality systems that Western manufacturers already operate.
Where Traditional Measurement Breaks Down
Where Traditional Measurement Breaks Down
Complex geometry exposes the first practical limit of conventional metrology. CMM touch probing, hand gauges, and optical comparators work well for prismatic parts with flat datum surfaces, simple bores, and orthogonal faces. The approach degrades quickly on freeform surfaces, deep undercuts, thin-wall sections, and blended radii.
Engineers attempting to validate an impeller, a stamped bracket with springback, or an additively manufactured housing often find that the number of discrete touch points required to characterize a sculpted surface exceeds what the inspection budget allows. The result is either sparse sampling that misses local deviation or dense sampling that slows the line.
Data continuity creates a second failure mode. Touch probing produces point clouds. Those points must then be interpolated into a surface, compared against the nominal CAD model, and converted into a deviation map. Every interpolation step introduces uncertainty. When a quality manager asks whether a weldment is within profile tolerance across its entire surface, a point-based answer is inherently incomplete.
The gaps between measured points remain unverified.
Delivery rhythm is the third constraint. First-article inspection on a complex casting can consume days. During that window, production either stops or runs at risk. For suppliers working under PPAP or AS9102 requirements, inspection throughput directly affects cash flow. A measurement system that captures full-field data in minutes changes the economics of first-article and in-process checks.
| Limitation | Traditional approach | Practical consequence |
|---|---|---|
| Freeform surfaces | Discrete touch points | Sparse data, missed local deviation |
| Data continuity | Point interpolation | Uncertainty between measured locations |
| Delivery rhythm | Sequential setup and probing | Hours to days per first article |
| GD&T complexity | Manual datum alignment | Operator-dependent repeatability |
The boundary condition is not accuracy alone. A CMM can be extremely accurate on a single point. The issue is coverage, speed, and the ability to turn measured geometry into actionable deviation data without losing information in translation.
Optical 3D part inspection addresses these limits by capturing dense surface data in a single acquisition cycle, but the principle matters more than the tool: inspection value depends on how completely the measured data represents the actual part surface, not on how precisely a few points were touched.
INSVISION’s approach to this problem focuses on full-field acquisition and software workflows that preserve data continuity from scan to report. The relevant evaluation criteria for any 3D part inspection system are the same: surface coverage, point density, acquisition speed, and the integrity of the CAD-to-measurement comparison pipeline.
How 3D Scanning Fits the Workflow
How 3D Scanning Fits the Workflow
The practical value of 3D part inspection depends on how cleanly scanning connects to downstream engineering decisions. In a typical manufacturing loop, inspection is not an isolated event. It is a sequence of capture, comparison, review, and reporting that must feed into existing quality and production systems.
- Scanning
The process begins with acquiring dense point-cloud or mesh data from the physical part. For complex freeform surfaces, castings, or sheet-metal components, this replaces slow tactile probing with full-field geometry capture. The goal is not simply a high-resolution mesh, but a dataset aligned to the part’s datum reference frame so that subsequent comparison uses the same coordinate logic as the CAD model.
- Comparison
The scanned mesh is overlaid against nominal CAD geometry or a golden reference part. Deviations are mapped to the surface using color plots. Engineers review these against GD&T callouts—profile tolerances, position, and runout—rather than raw point-to-point distances alone. This distinction matters. A dense color map may show local variation, but the pass/fail decision should reference the drawing’s tolerance zones.
- Review
Review is where dimensional data becomes engineering judgment. A quality engineer examines deviation patterns to separate systematic issues—tool wear, springback, fixture shift—from random process noise. Cross-sections, virtual callipers, and geometric dimensioning overlays help isolate root causes without cutting the part.
- Reporting
The final step connects inspection to traceability. Reports must be exportable to common formats for MES or third-party databases. In aerospace and medical manufacturing, this supports first-article inspection documentation and AS9102 or ISO 13485 record-keeping. The report is the audit trail, not an afterthought.
| Workflow Stage | Core Activity | Typical Output |
|---|---|---|
| Scanning | Full-field geometry capture | Dense mesh or point cloud aligned to datum frame |
| Comparison | CAD or reference part overlay | Deviation color map, GD&T tolerance evaluation |
| Review | Pattern analysis and root-cause filtering | Cross-sections, virtual measurement annotations |
| Reporting | Traceability and system integration | Export files for MES, quality databases, or first-article records |
A common misconception is that 3D scanning replaces the quality engineer’s judgment. It does not. It shifts the bottleneck from data collection to interpretation. That is why the workflow matters more than the scanner’s raw specifications.
A system that captures millions of points but cannot align them to the part’s datum structure, compare them against tolerance zones, or export results to the plant’s quality database adds little to the production line.
INSVISION’s approach to this workflow reflects the same sequencing: scanning hardware feeds comparison software, which supports review and reporting that connect to MES and third-party system databases. The integration point is not the scanner alone, but the handoff between measurement data and downstream quality decisions.
Validation Points Before Deployment
Validation Points Before Deployment
3D part inspection fits best where conventional metrology creates bottlenecks: first-article inspection on contoured surfaces, in-process checks on large weldments or castings, and MRO tasks where legacy CAD data may be incomplete. The method is less appropriate for verifying sub-micron surface finish or measuring deep, narrow bores where line-of-sight access is restricted.
Teams should confirm that tolerances on the drawing fall within the scanner’s stated accuracy envelope before committing to a program.
On-site verification should address four areas before production use:
| Validation Area | What to Check | Why It Matters |
|---|---|---|
| Environmental stability | Ambient temperature within the equipment’s rated range; no vibration sources nearby | Thermal drift and floor vibration directly affect repeatability |
| Reference geometry | Presence of stable tooling holes, datum targets, or reference spheres | Alignment routines require fixed features to anchor the scan data |
| CAD data quality | IGES or STEP files match the current engineering revision | A scan-to-CAD comparison is only as reliable as the nominal model |
| Operator protocol | Defined scan paths, calibration intervals, and pass/fail thresholds | Reduces person-to-person variation in results |
A common misconception is that a 3D scanner replaces a CMM outright. In practice, the two methods address different measurement problems. Structured-light or laser scanning excels at dense surface data on freeform geometry; tactile probing remains preferable for precise diameter or position checks on machined features. Many quality teams run both, using scan data for overall form deviation and a CMM for critical GD&T callouts.
If the scanner must exchange results with an MES or third-party database, verify the interface requirements before deployment. INSVISION systems, for example, support developing interactions with MES and third-party system databases, but the specific data mapping and transfer protocol should be confirmed during the site survey. Neglecting this step often leads to manual workarounds later.
Finally, confirm that the projected or scanned working volume covers the largest part family without requiring fixture repositioning. A scanner with a working distance of 1.3–3.5 m, for instance, imposes different setup constraints than a benchtop unit. Walk through one representative part from each product line during validation, not just a simple prismatic sample.
- What Is 3D Scanning? Principles, Workflow, and Industrial Applications 3D scanning is a digital measurement technology that converts the surface geometry of physical objects into 3D data. This entry covers its working principles, core parameters, industrial use cases, common misconceptions, and related technical…
- What Is a 3D Scanner? Types, Parameters, and Selection Criteria A 3D scanner captures three-dimensional surface data from physical objects and converts geometry, dimensions, and features into digital data for inspection, reverse engineering, and modeling.
- What Is 3D Scanning Accuracy? Accuracy, Repeatability, and Resolution Explained 3D scanning accuracy describes how closely scan data matches an object's actual geometry and dimensions. It is assessed through local accuracy, volumetric accuracy, stitching accuracy, repeatability, and resolution.
- What Is Point Cloud Data? Point Clouds, Meshes, and CAD Models in 3D Scanning Point cloud data is an important raw data format in 3D scanning. It consists of discrete 3D coordinate points that describe object surface geometry and support inspection, reverse engineering, modeling, and archiving.
Hangzhou Insvision Technology Co., Ltd.
Address: Building 1, No. 1399 Liangmu Road, Yuhang District, Hangzhou, Zhejiang 311121, China
Copyright © Hangzhou Insvision Technology Co., Ltd. All rights reserved.
Copyright © Hangzhou Insvision Technology Co., Ltd. All rights reserved.