

How a 3D Scanner Compares Large Welded Parts to CAD for Dimensional Inspection
See how the INSVISION V-Track tracking-based 3D scanner captures large welded assemblies and compares measured geometry against CAD for full-dimensional deviation analysis.
A 3D scanner connects a physical part to its nominal CAD design by capturing measured surface geometry as dense digital data that can be compared directly against the theoretical model. For large welded assemblies, the INSVISION V-Track tracking-based laser 3D scanning system performs this task through an optical tracking workflow: a fixed tracker continuously locates the handheld scanner in space, so each captured frame is registered into a single coordinate system without applying markers to the workpiece. The resulting mesh can then be aligned with the CAD model for full-dimensional deviation analysis. Manufacturing teams gain a direct, quantitative view of where a physical structure departs from design intent, rather than relying on scattered point measurements or repeated station moves that accumulate positioning error.
How 3D scan data connects to CAD for full-dimensional inspection
The scan-to-CAD workflow moves through distinct stages, each with a clear equipment or software role. Acquisition begins with the handheld scanner capturing surface points across the part while the fixed optical tracker continuously determines the scanner's position and orientation, keeping every frame in the same coordinate system. After acquisition, the data is processed into a high-precision STL mesh that records the complete measured surface geometry. That mesh is then imported into inspection software and aligned with the original CAD model for full-size deviation calculation.
The software generates a color deviation map that uses color to indicate the amount and direction of deviation in each area, from global distribution down to local details. The scanner acquires geometry; the downstream software performs alignment and comparison against the nominal CAD reference.
Why tracking-based scanning changes CAD comparison for large welded parts
Large welded parts create specific problems for CAD-based inspection that contact methods handle poorly. Workpieces in heavy machinery, shipbuilding, rail, and large steel structures often exceed the reach of a physical measuring arm, forcing operators to move equipment repeatedly, rebuild coordinate systems, and stitch local data sets together. Each station move introduces positioning error that accumulates across the part. These structures also carry extensive stiffeners, corner welds, deep cavities, and narrow slots where contact probes cannot enter to collect usable data.
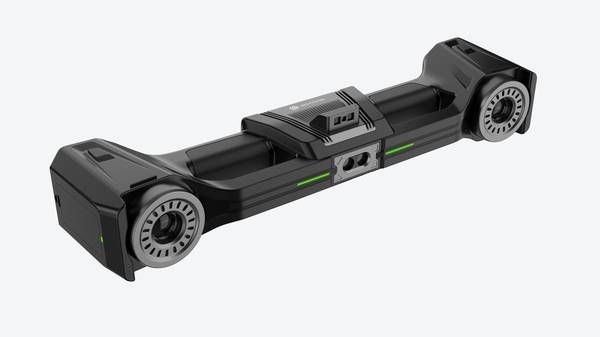
V-Track addresses both limitations. The fixed optical tracker captures the handheld scanner's position and orientation in real time, so every frame is located in the same coordinate system without markers on the workpiece surface. Setup is reduced to positioning the tracker and preparing the handheld scanner. The wireless, battery-powered scanning unit lets operators reach elevated exterior surfaces and narrow gaps between reinforcement plates without cable constraints. A maximum scan area of 2600×2200 mm and a scan rate up to 7.1 million measurements per second allow single passes to cover large areas and reduce re-traversal, while tracking accuracy up to 0.025 mm maintains stable positioning across large measurement volumes.
What the CAD comparison output delivers for manufacturing teams
The value of the scan-to-CAD result extends beyond a single pass/fail reading. The color deviation map lets engineers quickly identify where deviations concentrate across the part, then correlate those patterns with welding sequence, fixture positioning, and other process parameters to locate the likely cause of deformation. This gives teams a quantitative basis for adjusting process settings or fixture layouts. Each scan's STL data and deviation report can also be archived to build a complete dimensional history of the product.
That archive supports batch quality statistics, process capability analysis, and trend warning, forming a digital quality loop from inspection data back to process improvement. The output is not merely a point cloud; it is a measurable, traceable record that connects physical reality to the CAD definition and helps manufacturing teams act on the difference.
Hangzhou Insvision Technology Co., Ltd.
Address: Building 1, No. 1399 Liangmu Road, Yuhang District, Hangzhou, Zhejiang 311121, China
Copyright © Hangzhou Insvision Technology Co., Ltd. All rights reserved.
Copyright © Hangzhou Insvision Technology Co., Ltd. All rights reserved.